On-screen reports (P)


|
On-screen reports (P) |
|
|
We have many types of elements of a Engage Process Modeler project: processes, process steps, roles, custom items, documents. Cross reference reports show dependencies between the elements of different types. (Brainstorm and Overview diagrams are not taken into account for these reports.) All cross-reference reports are available in the Reports tab.
Each simple cross reference report is showing dependencies between two types only. Thus, it is showing elements of a type X against elements of another type Y (Xs per Y) and is available in two views:
If an element of type X (Y) does not have a relation to any element of type Y (X) it is not shown in the view at all.
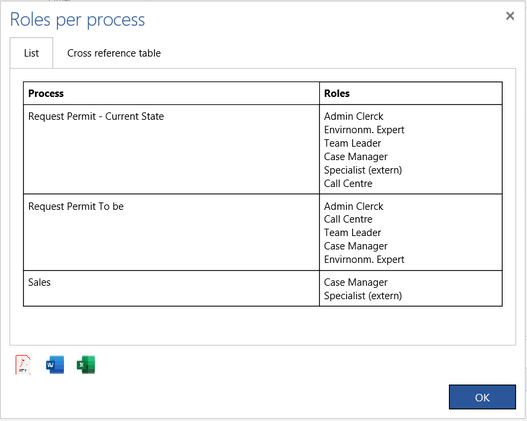
The List view consists of two columns. The first one shows elements of type Y, the second one - the sets of all elements of type X referred by Y. For example, in the Roles per process list view the first column shows processes, the second one - groups of roles referred by a specific process.
Press the button with the PDF icon, Microsoft Word icon or Microsoft Excel icon to download the List view as a PDF file, a Microsoft Word document, or a Microsoft Excel spreadsheet, respectively.
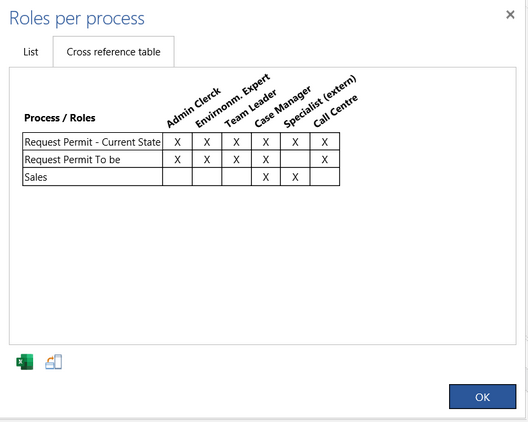
The Cross reference table view is a table with rows for each element of type X and columns for each element of type Y. A cross inside the table indicates that a given element of type X is related to an element of type Y. For example, in the Roles per process cross reference table view, the rows are marked by processes and the columns are marked by roles.
Press the button with the Microsoft Excel icon to download the Cross reference table view as a Microsoft Excel spreadsheet. Press Swap Headers button to swap rows and columns of the table getting Ys per X reference table instead of Xs per Y reference table.
The following table shows what cross reference reports are available.
Reports "Xs per Step" or "Steps per Y" are calculated for one process diagram only. Read the detailed information about what exact items are shown in the report lists.
There is also a possibility to create multiple cross reference reports involving more than two columns. For example you can create Steps per Role per Document per Item report.
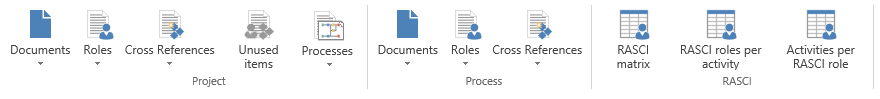
The on-screen reports are divided in the following groups:
Reports in the Process and RASCI groups are calculated for one process diagram only so you have to open a diagram first before you run this report. Reports in the Project group take into account all process diagrams in the opened project. By pressing the Cross references button and then Cross references item you will be able to select a cross reference report. There are some shortcuts for the cross reference reports under the Documents and Roles buttons. The Processes reports in the Project group give you the overview of all processes.
There are some exceptions from the rules described above. For RASCI reports there are two List views corresponding to only one Cross reference table view. Reports about unused items, input/output, process and multiple cross references have only the List view.
|