Evaluation results


|
Evaluation results |
|
|
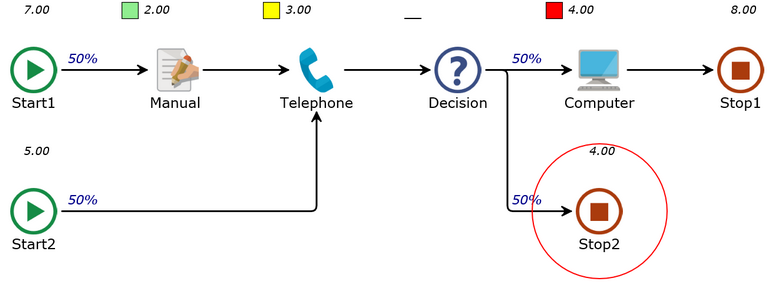
Consider the following process diagram with processing time shown on top of the process steps:
The input values for processing time of the Manual, Telephone and Computer steps are 2, 3 and 4, respectively. The results of evaluation are shown above the start and stop steps. If the process is started from Start1 its processing time is equal to 2 + 3 + 50%*4 = 7 If the process is started from Start2 its processing time is equal to 3 + 50%*4 = 5 If the process ends in Stop1 its processing time is equal to 50%*2 + 3 + 4 = 8 If the process ends in Stop2 its processing time is equal to 50%*2 + 3 = 4 However, the average total processing time of this process is equal to (7 + 5 + 8 + 4) / 4 = 6.
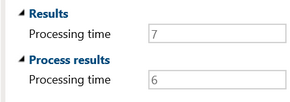
After the evaluation, the process diagram view automatically switches to the evaluation mode. You will see two additional categories in the Property pane: Results and Process results. Results are showing the values for the selected step whereas Process results are always showing the average total results for the whole process.
The same process results are shown in the Properties pane when you select the evaluated process in the Project pane. |