Showing/hiding measure balloons (P)


|
Showing/hiding measure balloons (P) |
|
|
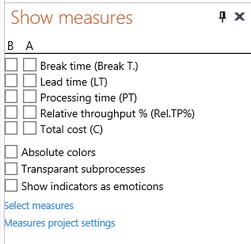
In order to show measure values on the process diagram press the Measures button in the Show / hide group of the Layout tab. An additional pane Show measures will be opened.
It will contain a list of the selected measures (if the list is empty click Select measures link to open the Select measures dialog). There are two columns of check boxes in front of the measure names: B (below) and A (above).
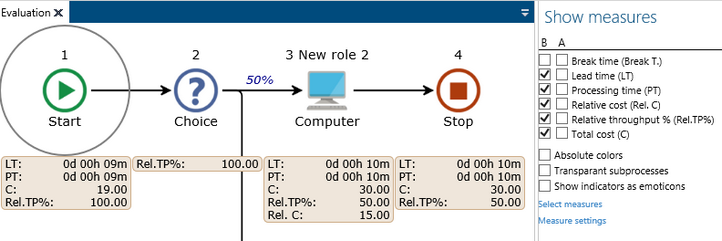
You can decide what measures are to be shown in balloons below a process step by clicking the corresponding check box in the B column of the Show Measures pane.
Note that because of the lack of space a short name for a measure (e.g. PT for processing time) is used in the balloon (this name is also shown in the parentheses in the Show Measures window). The process layout is expanded vertically in this case to create space for the balloons with the measures. Up to 7 measures can be shown in a balloon. If a measures is not defined for a certain process step it is not shown in the balloon. For example, Relative cost (RC) is shown only for a task.
Measure balloons are never shown together with the input/output or RASCI balloons. So, if you press the Measures button while the Input/Output or RASCI button is on the measures balloons will appear and the other balloons will disappear.
Measure values can also be presented above steps. If you select the Start date measure for your process and assign to it a process starting date then the End date will be evaluated for your whole process and the Start date and End date will be evaluated for every process step. You can also show both the Start date and End date in the measures balloons, however you cannot show them above steps. |