Presenting measures (P)


|
Presenting measures (P) |
|
|
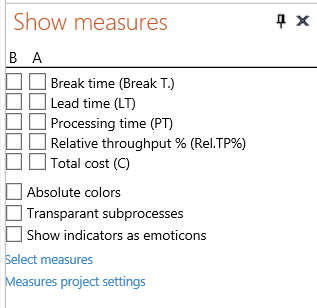
The selected measures for a process or a process step can be graphically shown on the process diagram. The set of measures to be shown there is determined by the selection in the Show Measures pane. By default this pane is hidden. You can only make it visible in the following ways:
The pane contain a list of the selected measures (if this list is empty click Select measures link to open the Select measures dialog). There are two columns of check boxes in front of the measure names: B (below) and A (above).
In order to show measures in balloons below process steps follow the instructions there.
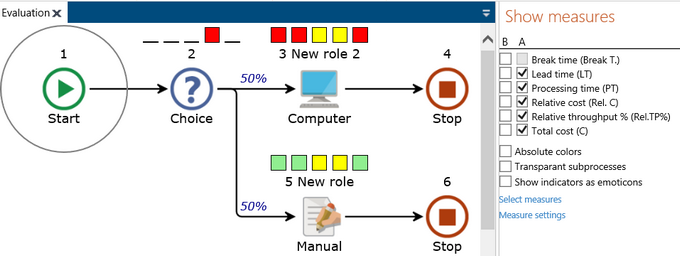
In order to show measures on the process diagram above process steps check the corresponding box in the A column close to the measure name (you can select up to 5 measures in this way). The selected measures are presented as a sequence of squares on top of the process step icon. Move the mouse pointer onto a square to see the name of the measure and its actual value.
The color of the square represents the position of the value in the value range (see Measures settings). A small horizontal line indicates that the measures is not defined for a given process step at all (only the fourth selected measure, in this case the Relative throughput, is defined for the Choice step).
Reverse coloring
The squares are drawn in green, yellow or red depending on the measure value and Measures settings . By default, red color indicates high values that require attention and green color indicates low values that are acceptable. In certain situations this coloring is reversed. For example, since rather a high score is acceptable for the Reliability measure the low values of reliability are shown in red (attention!) and the high values in green.
Absolute coloring
The color of the presented value depends on the value's relation to the other values of the same measure. By default, the values are related to the interval between the minimum and maximum value for a given measure in the process. Thus, the minimum value will always be shown as acceptable and the maximum one as requiring attention.
In some situations even minimum values can require attention if they are relatively high enough. By checking Absolute colors box in the Show measures pane you can change the related interval of values to be between 0 and the maximum value for all presented measures. Measures expressed in percentages are always shown in relation to the interval 0-100%.
Transparent subprocesses
By default, the measures for the whole subprocess are compared with the measures for the other process steps in a process. Since a subprocess can have many steps inside its measures values like e.g., overall Lead time or Total cost, can be relatively much higher than the values of the same measure for the other tasks. Thus, the measure values for subprocesses will be presented as requiring attention.
In many cases a subprocess is not a combined task but rather a mean to make a process more readable. Then, we are not interested in the total values for a subprocess but in values inside the subprocess. To see extreme values in a subprocess instead of the total values for the subprocess check Transparent Subprocesses box in the Show measures pane.
Show measures as Emoticons
When the measures are displayed on the process diagram they are drawn as colored squares. The colors express acceptation, attention or warning. If Show indicators as Emoticons is checked the squares are replaced by corresponding emoticons. |