Measures settings (P)


|
Measures settings (P) |
|
|
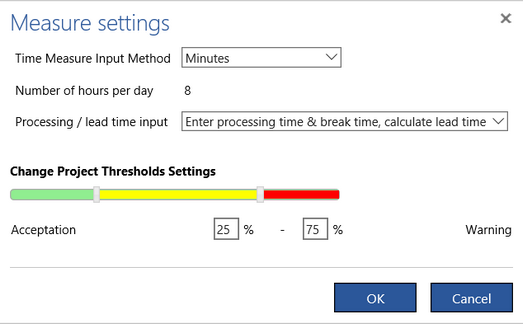
You can set up the way the measures are presented. These settings will apply for all processes in the project. Press the Settings button in the Measures group of the Analysis tab (you can also click a link in the Select measures dialog or on the Show measures pane). The following dialog appears:
You can decide here on:
There are three formats of showing a time value available:
If you select the last format you have also to specify the Number of hours per day. By default, it is set to 8 hours as in the example above. If you change this number to e.g.,16 then the presentation of the above value will change from 0001 d 00 u 20 m to 0000 d 08 u 20 m. Put 24 there if your processes are being processed round the clock.
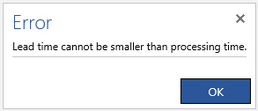
Engage Process Modeler allows to model the fact that during the execution of an activity there can also be some breaks. This is achieved by adding the Break time measure to an activity. Then, the Lead time of the activity (so, the total time a case has spent there) is calculated as the Processing time plus the Break time. In some situations however, you do not know the Break time but you do know the observed Lead time. Then, you can change Process /lead time input option from Enter processing time & break time, calculate lead time to Enter processing time & lead time, calculate break time. Depending on this selection the Break time will appear in the Input measures category and the Lead time in the Results category, or vice versa. If both the Processing time and the Lead time are input values they are correctly specified only if the first one is not bigger than the second one. If this rule is not satisfied the evaluation of the process will end with the following error.
Double click this message in the Message pane to go to the step with the wrongly defined values (if you do not see the Message pane then show the hidden pane).
Measure values can be shown graphically on the process diagram. To draw your attention to the extreme values we use green, yellow and red colors for values that are acceptable, require attention or give a warning, respectively. The color of a value is determined according to its position between the minimum and maximum values possible. A value close to the minimum is green, a value close to the maximum is red. By default, these ranges are set to 25% and 75%. You can change them by moving the borders between colors on the slider or by typing new values in the edit boxes.
|