Showing/hiding process diagram details


|
Showing/hiding process diagram details |
|
|
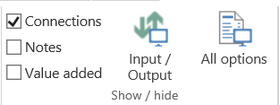
You can decide what details will be shown on the process diagram by checking on or off the boxes or by pressing buttons in the Show/hide group in Home tab. This, however, will be only the initial setting for the Engage Process Viewer. A viewer can still change the way a process diagram is presented although you can block this possibility for Notes and Annotations in the viewer settings.
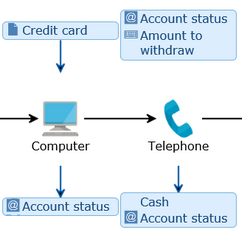
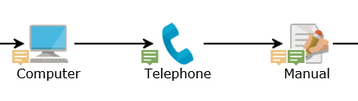
Press the Input/Output button to show input and output items for activities and subprocesses (service, phases). Click it again to hide these items. Notice the the layout of the process may be expanded vertically to make place for the input (on top) and output (below) balloons.
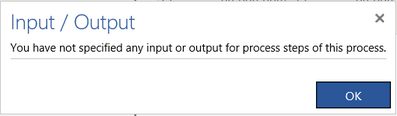
If there is no input/output document specified for any of the process steps the diagram does change and the following message appears to inform you:
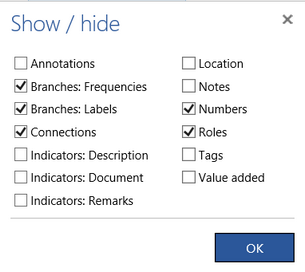
Three most frequently used check boxes (Connections, Notes and Value added) are shown in the Show/hide group. Click the All options button to open a dialog with all available check boxes.
The following table explains the meaning of this check boxes:
If there are custom types defined for a selected process they will also appear on this list (Location in the example above). Custom type values will appear above the step icon. Since the Tags and the Numbers appear in the same place on the diagram only one of them can be checked at a time. The same applies to the Roles and the custom types.
Description and remarks indicators:
Description is marked by
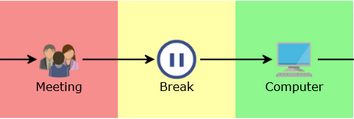
Presentation of value adding activities:
In this case, the Meeting step is non value adding, Break is business value adding and Computer is customer value adding .
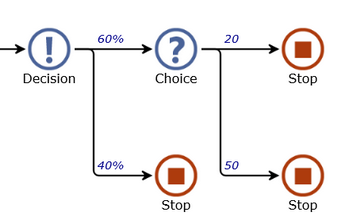
Presentation of frequencies:
If all the frequencies of a choice sum to 100 then they are shown as percentages. |