Statistics


|
Statistics |
|
|
The following statistics are calculated by Engage Process Modeler:
If there are already custom types defined in the project (not possible in Starter edition) then (similarly as for Roles) the list above will be extended with two more statistics per each defined type: number of different items of this type used in the process and number of item changes. For example, if you have added Location type there will be Number of Location and Number of Location changes added. If Number of tasks, Number of Roles or number of different custom items (e.g., Number of Location) are bigger than 0 then also numbers of each type of tasks, roles or items are calculated. You can see these numbers after pressing a small triangle in front. Notice that if a process has 3 Manual tasks and 2 Telephone task then the Number of tasks will be 5. However, if a Role1 us used 3 times and a Role2 is used 2 times the Number of roles will be equal to 2 because only 2 different roles are used in the process.
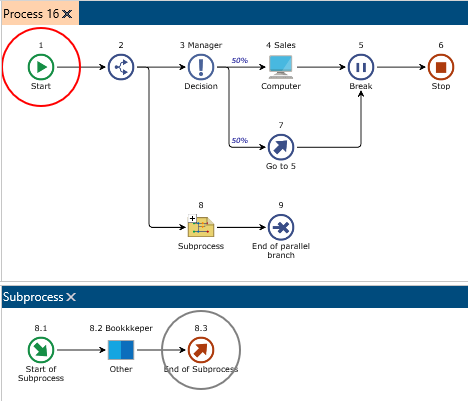
We will explain statistics on the following process example:
You can ask for statistics for the whole process and for each particular subprocess. If a subprocess is selected then the statistics for this particular subprocess (and the subprocesses inside) is shown. Otherwise the statistics for the current process or subprocess diagram and all its subprocesses is shown.
Press the Statistics button in the Statistics group of Analysis tab.
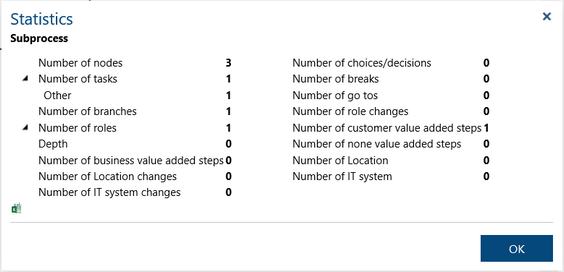
If the focus is on the Subprocess step of the process diagram or on one of the steps of the Subprocess diagram itself then the Statistics dialog that appears will show the results for the subprocess:
The subprocess does not have subprocesses so its Depth is 0. There is only one role used in the subprocess so the Number of role changes is also 0. There is one task including one task of type Other.
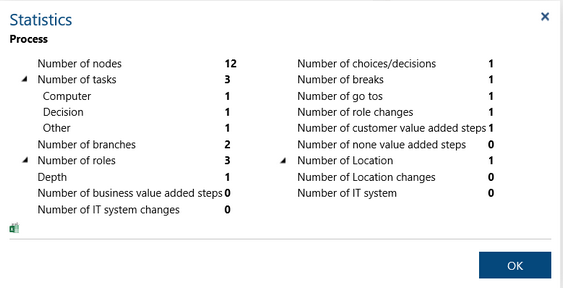
If the focus is on one of the process steps except the Subprocess step then the Statistics dialog that appears will show the results for the process:
There are 9 steps in the process diagram and 3 steps in the subprocess diagram so the Number of nodes of the whole process is 12. The Number of tasks is 3: one Computer and one Decision in the main process and one Other in the subprocess. Although the Number of roles is 3 the Number of role changes is only 1 (from Manager to Sales in the main process). The process contains one subprocess with the depth 0 so its Depth is 1.
Press the button with Microsoft Excel icon to export the statistics to an Excel spreadsheet.
|